How does Power Monitoring work?
Our power monitoring surveys analyse the electrical power on single phase or three phase systems over a period of time, often a week or more. Our power monitoring surveys are tailored to focus on a particular area of concern, be it graphical power consumption (load profile), power harmonics and disturbance analysis.
- Electrical load profile – Volts, Amps, W, VA, KWh & PF
- Power harmonics – We can take regular snapshots of voltage and current waveforms with analysis up to the 50th harmonic.
- Disturbances – Impulses/spikes, waveshape faults, voltage dips/surges, RMS voltage & current.
When instructed we will deliver, install and set-up a suitable instrument on site to collect any data requested by our client. At the end of the monitoring period we will remove the instrument and provide you with a full report, including graphical analysis of the captured data.
The mains supply voltage in the UK must be within 230 V +10% / -6% (253V-216V). In Europe the voltage is 230 V +6% / -10% (244V-207V), thereby allowing the European 220V system to stay at 220V and the UK to stay at 240V yet both appear to be harmonised.
If any anomalies are detected, we will offer you impartial advice for reducing or eliminating power-related problems such as disturbances or harmonics.
For more information on the benefits of power monitoring surveys click here.
Why don’t you make use of our power monitoring services today? Call us on 01920 871077 for fast, no pressure advice and assistance. You can also get in touch with us via our contact page. We would be happy to respond to any enquiries you may have.
Power Monitoring Technical Data Examples:
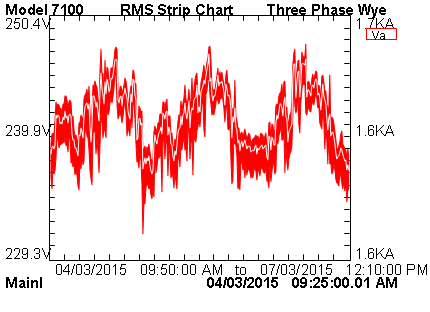
< RMS voltage graph for the entire monitoring period.
A zoom feature enables the viewing of daily or hourly information.
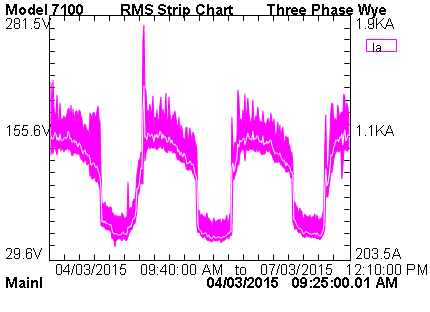
> RMS current graph for the entire monitoring period.
A zoom feature enables the viewing of daily or hourly information.
< Static Transfer Switch supply change-over by command.
All graphs have a zoom feature, voltage and current can be displayed on the same graph.
> Static Transfer Switch supply change-over in emergency (power failure) mode.
All graphs have a zoom feature, voltage and current can be displayed on the same graph.
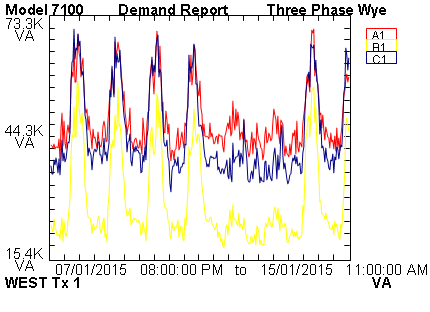
< KVA summary graph for the entire monitoring period.
A zoom feature enables the viewing of daily or hourly information. A TOTAL KVA summary is also available.
> Neutral to earth RMS voltage graph for the entire monitoring period.
The cause of the high neutral voltage was found to be a loose connection on the main incoming neutral.
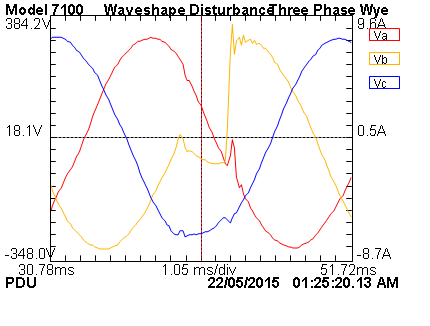
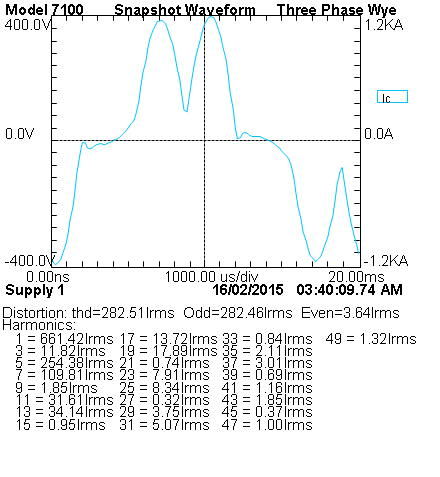
< Current harmonic snapshot
This graph shows the current waveshape being drawn by a business with the level of harmonic currents associated. This was caused by two parallel 500kVA UPS systems with no input harmonic current filtration.
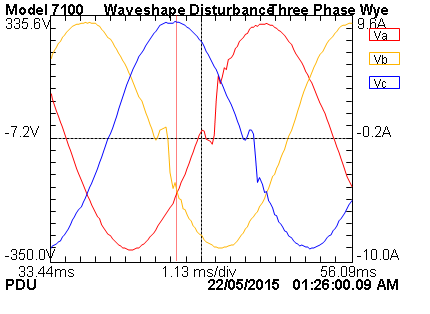
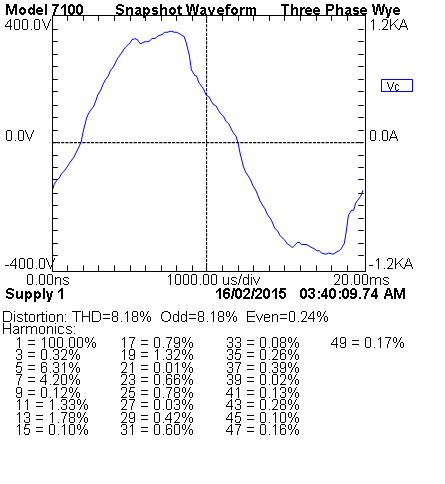
> Voltage harmonic snapshot
This graph shows the voltage waveshape distortion caused because of the current waveshape being drawn above. The voltage distortion caused problems with lights and microprocessor based systems on the same site.
Cetronic have been providing nationwide on-site power monitoring surveys for over 30 years. We cover the entire UK monitoring the power to any particular device, room, floor, building or site. If you have any questions about our Power Monitoring Services, please contact us now.